

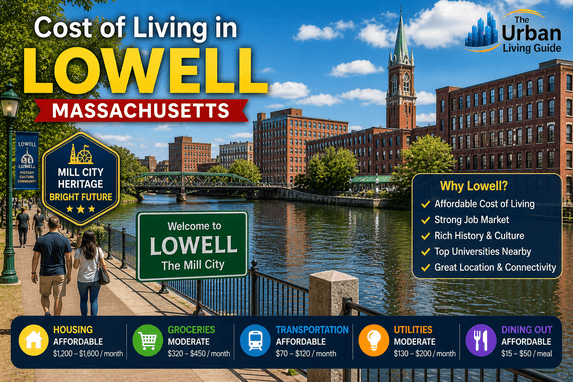
Cost of living in Lowell, Massachusetts 2026: Mill City Expenses, Merrimack River Value & MBTA Commuter Realities
Living along the historic industrial canals and Merrimack River shores of the legendary Mill City for nearly a decade has given me a front-row seat to the economic transformation of Lowell, Massachusetts in 2026. Whether you are relocating from expensive coastal tech corridors or moving inward from Greater Boston, this proud Merrimack Valley hub offers a vibrant blend of 19th-century textile heritage, cultural diversity, and world-class higher education anchored by the University of Massachusetts Lowell (UMass Lowell).
Evaluating the true cost of living in Lowell, Massachusetts reveals that housing valuations and rental rates track significantly below Greater Boston benchmarks while providing exceptional commuter connectivity via the MBTA Commuter Rail. For official municipal services, community programs, and local zoning announcements, residents frequently consult the City of Lowell Official Portal.
Average Monthly Expense Breakdown in Lowell, Massachusetts
Monthly expenses in Lowell vary widely depending on household size, lifestyle choices, and exact neighborhood positioning across Middlesex County. Below is a structured monthly financial breakdown displayed in a clear comparative table format reflecting current economic conditions in 2026:
| Expense Category | Single Adult | Couple | Family of 4 |
|---|---|---|---|
| Housing / Rent | $1,350 – $1,850 | $1,850 – $2,650 | $2,750 – $3,950 |
| Groceries & Food | $340 – $460 | $620 – $890 | $1,050 – $1,520 |
| Transportation & Commute | $130 – $250 | $250 – $450 | $420 – $750 |
| Utilities & Internet | $155 – $260 | $230 – $380 | $370 – $600 |
| Healthcare & Insurance | $150 – $380 | $380 – $780 | $750 – $1,450 |
| Childcare & Education | $0 | $0 | $1,200 – $2,300+ |
| Entertainment & Leisure | $140 – $320 | $280 – $560 | $470 – $890 |
Residents frequently emphasize that while analyzing the overall cost of living in Lowell, Massachusetts requires budgeting for rigorous winter heating loads and municipal property taxes, taking advantage of local retail markets and commuter rail options keeps monthly household ledgers well-managed.
Housing Costs, Real Estate & Neighborhood Maintenance in the Mill City
Housing represents the single largest variable when assessing the cost of living in Lowell, Massachusetts, displaying a diverse spectrum from historic brick mill loft conversions in Downtown Lowell to multi-family triple-deckers in The Acre and single-family suburban homes in Belvidere. Rental inventory and real estate options vary significantly depending on neighborhood positioning:
- Studio apartments in revitalized downtown mill buildings typically lease between $1,150 and $1,550 per month.
- 1-bedroom apartments across established neighborhoods range from $1,350 to $1,850 per month.
- 2-bedroom apartments span $1,700 to $2,450 per month, accommodating roommates and growing families.
- Single-family detached homes and historic properties across premier residential enclaves like Belvidere command monthly rents or mortgage equivalents from $2,400 to $4,200+.
For prospective home buyers, the median residential listing price across city limits hovers near $445,000, offering substantial cost relief compared to Greater Boston markets. Homeowners must also budget for local property tax assessments managed across Middlesex County, which support regional public school districts and municipal infrastructure.
Watch this video to get a closer look at housing and neighborhood pricing in Lowell, Massachusetts.
Retail Food Markets, Supermarkets & Dining Expenses in the Merrimack Valley
Food and everyday grocery expenditures in Lowell track close to regional averages, giving households diverse and economical shopping options across local retail networks:
- Major regional grocery options are anchored by discount favorites like Market Basket, regional supermarkets like Stop & Shop, warehouse clubs in neighboring Chelmsford, and vibrant specialty ethnic food markets across Centralville and The Acre.
- Fresh produce, artisanal baked goods, and specialty items are sourced weekly by residents visiting local farmers markets and open-air plazas.
- Dining out expenses span a very accessible culinary spectrum; casual neighborhood cafes average $14 to $21 per person, while regional fine dining scales from $45 to $95+ per person.
Public School Systems, Daycare Rates & UMass Lowell Academic Proximity
Educational planning across the metropolitan area involves balancing public school districts, charter networks, and respected private institutions:
- Infant daycares and full-time childcare facilities typically range between $1,100 and $1,750 per month per child across Middlesex County.
- Preschool programs average $750 to $1,350 per month, preparing young learners for local kindergarten placement.
- Public education is served by Lowell Public Schools, while families seeking higher education proximity benefit from immediate access to UMass Lowell research centers.
- Private and parochial academies command annual tuitions ranging from $12,000 to $28,000+.
MBTA Commuter Rail, LRTA Bus System & Commuter Outlays
While Lowell features a robust transit network, daily commuting patterns heavily influence household transportation budgets across the Merrimack Valley grid:
- Personal vehicle operation requires factoring in regional fuel costs, which fluctuate around $3.10 to $3.70 per gallon, alongside Massachusetts auto insurance premiums averaging $1,350 to $1,750 annually.
- Public transit is operated by the Lowell Regional Transit Authority (LRTA) bus network and the MBTA Commuter Rail (Lowell Line) running directly out of the Gallagher Transportation Center to Boston’s North Station, with monthly rail passes costing approximately $320 to $380.
- Commuting corridors rely heavily on I-495, Route 3, and Route 38 for regional travel.
National Grid Utilities, Seasonal Energy & Home Maintenance Expenses
Because New England experiences rigorous winter freezes and humid summer cooling cycles, utility budgeting requires careful seasonal planning:
- Electricity and natural gas are primarily supplied by National Grid, with average monthly bills ranging from $150 to $300 for apartments and higher for detached homes during peak winter heating and summer cooling loads.
- Water, sewer, and stormwater services managed by the City of Lowell Wastewater Utility typically add $60 to $110 per month to household ledgers.
- High-speed broadband internet through providers like Xfinity and Verizon Fios generally runs $55 to $95 per month.
Lowell General Hospital & Local Health Insurance Costs
Lowell features dependable healthcare networks and clinical facilities, providing residents with dependable local medical access:
- Major medical networks are anchored by Lowell General Hospital (part of Tufts Medicine), offering comprehensive emergency care, trauma services, and specialized regional clinics across its two primary campuses.
- Employer-sponsored health insurance premiums typically deduct $115 to $320 per month for individuals and $420 to $820 per month for comprehensive family coverage plans.
- Out-of-pocket routine medical care, specialist consultations, and dental services track close to national averages, supported by neighborhood wellness centers.
Lowell National Historical Park, Tsongas Center & Local Recreation
Recreational and lifestyle spending in Lowell reflects a proud industrial history rooted in national parks, sports arenas, and riverfront trails:
- Iconic cultural attractions include the historic exhibits at the Lowell National Historical Park, concerts and River Hawks hockey at the Tsongas Center at UMass Lowell, and the Lowell Summer Music Series at Boarding House Park.
- Outdoor recreation features scenic walking paths along the Merrimack River and green spaces across Shedd Park.
- Fitness club memberships and boutique wellness studios average $30 to $75 per month.
Veterinary Care & Pet-Friendly Urban Amenities in Lowell
For pet owners moving to the Mill City, Lowell offers welcoming neighborhood parks and commercial amenities:
- Veterinary care and routine wellness checkups average between $45 and $75 per standard examination across local animal hospitals.
- Pet insurance premiums for dogs and cats range from $30 to $70 per month depending on coverage tiers and animal age.
- Dog-friendly outdoor recreation is highlighted by dedicated green spaces and park trails within the municipal park system.
New England Winter Weather, Historic Mill Upkeep & Middlesex County Cost Drivers
Living in this historic Merrimack Valley hub introduces specific environmental and seasonal maintenance factors that directly impact annual household budgeting:
- Northeastern winter heating demands require budgeting for elevated natural gas and electricity consumption from November through March.
- Historic mill loft upkeep for property owners and renters involves maintaining older architectural structures and managing regional weather impacts.
- Urban parking regulations and resident permit requirements factor into vehicle storage expenses for downtown residents.
Middlesex County Property Assessments & Massachusetts Tax Frameworks
Tax obligations in Lowell combine state income tax with local property assessments:
- Massachusetts state income tax follows a flat structure of 5.00%, providing a predictable tax baseline for working professionals and families.
- Lowell municipal property tax rates reflect Middlesex County assessments, featuring residential rates averaging roughly 1.10% to 1.35% of assessed market value annually.
- Local retail sales tax within the state stands at an inclusive rate of 6.25%, contributing to public services.
Financial Viability: Is the Cost of Living in Lowell Worth the Investment?
- Remarkable Commuter Value: Direct MBTA commuter rail service from the Gallagher Transportation Center to Boston provides powerful professional mobility without Greater Boston rental premiums.
- Rich Industrial & Academic Heritage: Proximity to the Lowell National Historical Park and UMass Lowell delivers unique cultural landmarks and steady economic development.
- Accessible Housing Market: Your monthly housing dollar stretches significantly further here than in Boston or Cambridge.
- Deliberate Trade-Offs: Winter heating demands and municipal tax rates require structured budgeting, but overall daily expenses remain highly competitive.
Segment Analysis: Financial Winners and Budget Pressures in the Mill City
Understanding cost positioning requires examining how different financial brackets experience life across the metropolitan region:
Who May Find Lowell Expensive
Entry-level service workers, minimum-wage earners, and independent renters in newly revitalized downtown mill lofts may find certain rental pockets financially demanding. When combining rising lease rates, auto insurance premiums, and winter heating bills, modest entry-level paychecks can experience noticeable monthly budget compression.
Who Can Afford It Comfortably
Conversely, established healthcare professionals at Lowell General Hospital, UMass Lowell faculty, corporate commuters, and dual-income families find Lowell exceptionally comfortable. Individuals and households earning annual incomes upward of $75,000 to $100,000+ can effortlessly secure spacious real estate in premier neighborhoods like Belvidere, fund robust retirement accounts, and fully enjoy the region’s rich cultural amenities without financial anxiety.
Downtown Core vs. Belvidere and Suburban Enclaves: Expense Comparison
Comparing the urban core of Downtown against surrounding residential and suburban enclaves highlights critical lifestyle trade-offs:
| Cost Parameter | Downtown Core | The Acre (Historic District) | Belvidere (Residential Enclave) | Chelmsford (Adjacent Suburb) |
|---|---|---|---|---|
| Housing (1-2 BHK Rent) | $1,350 – $1,950 | $1,250 – $1,750 | $1,800 – $2,700 | $1,750 – $2,600 |
| Parking & Garage Fees | $100 – $180/mo | Free / Street Parking | Free / Driveway Parking | Free / Included |
| Transportation & Commute | Gallagher transit hub & LRTA buses | Walkable urban core | Route 38 & commuter routes | Route 3 & I-495 commuter access |
| Childcare & Schools | Lowell Public School options | Neighborhood school zones | Top-rated Belvidere school clusters | Exemplary Chelmsford school district |
| Entertainment & Dining | Tsongas Center, dining & lofts | Local markets & eateries | Historic parks & quiet streets | Suburban shopping & parks |
| Home Maint. / HOA / Taxes | Urban property assessments | Multi-family property maintenance | Suburban property assessments | Suburban tax assessments |
| Car Ownership vs. Transit | Optional near rail station | Recommended | Recommended | Mandatory |
Strategic Insight: Young professionals and Boston commuters frequently thrive in walkable intown neighborhoods near the Gallagher Transportation Center for rapid commuter rail access, while growing families gravitate toward residential enclaves like Belvidere for architectural character and neighborhood stability.
Smart Budgeting Strategies for Lowell Residents
Optimizing your monthly budget while maintaining a comfortable cost of living in Lowell, Massachusetts becomes seamless when applying these localized financial strategies:
- Utilize the MBTA Commuter Rail from the Gallagher Transportation Center for your daily commute to Boston to eliminate expensive monthly parking garage fees and traffic tolls.
- Enroll in budget billing plans with National Grid to smooth out seasonal utility payment spikes during peak winter heating months.
- Shop weekly grocery specials at discount supermarkets like Market Basket instead of relying entirely on specialty gourmet outlets.
- Take advantage of free community attractions, including historic exhibits at the Lowell National Historical Park and summer concert series at Boarding House Park for weekend leisure.
- Explore community energy efficiency rebates offered through local utility programs to upgrade residential insulation and reduce long-term utility loads.
- Leverage employer pre-tax transit benefits or commuter accounts to reduce federal and state taxable income while paying for public transportation.
- Patronize neighborhood restaurant happy hours and early-week dining specials across downtown rather than weekend peak hours.
- Participate in local tool-lending libraries and community garden plots operated across Middlesex County to minimize home maintenance equipment expenses.
Local Resident Realities: Veteran Perspectives on Household Expenses
“Renting an apartment near downtown Lowell gave me an amazing direct commuter rail connection straight into Boston, and my monthly expenses are still remarkably manageable compared to what my former colleagues pay inside Route 128.” — Cian M., Downtown Lowell resident of 7 years (Feedback sourced from Merrimack Valley urban living forums & community boards)
“Buying our home in Belvidere was a fantastic long-term investment, but municipal property taxes and winter heating bills are definitely factors you need to plan for carefully in Middlesex County.” — Siobhán O., Belvidere homeowner of 11 years (Feedback sourced from Lowell neighborhood association reviews)
Frequently Asked Questions About Living Costs in Lowell, Massachusetts
How does the overall cost of living in Lowell compare to the national average?
The overall cost of living in Lowell tracks roughly 15% to 20% above the national average. While certain expenses like winter heating bills and local property taxes require careful attention, housing and rental valuations remain notably more affordable than Greater Boston metropolitan markets.
What is the average monthly rent for a 1-bedroom apartment in Lowell?
A standard 1-bedroom apartment in Lowell typically leases between $1,350 and $1,850 per month. Rent prices vary depending on whether you choose a modern mill loft downtown or a residential apartment in surrounding neighborhoods like Belvidere.
Are utility bills expensive during extreme weather months in Lowell?
Utility bills experience noticeable fluctuations due to rigorous New England winters that drive up heating usage. On average, combined household utilities range from $155 to $290 per month, which can be easily stabilized by enrolling in utility budget billing plans with National Grid.
Is a personal vehicle necessary for commuting around Lowell?
While the LRTA bus system and MBTA Commuter Rail provide reliable transit connecting urban neighborhoods, Lowell is fundamentally a car-centric Merrimack Valley city. Owning a personal vehicle is recommended for efficient travel across the broader county grid.
What annual income is required for a single adult to live comfortably in Lowell?
A single adult earning an annual salary between $65,000 and $85,000 can live very comfortably in Lowell, easily covering rent, vehicle expenses, health insurance, groceries, and recreational outings without severe financial pressure.
How do property taxes impact home buyers in Middlesex County?
Property tax assessments in Lowell average roughly 1.10% to 1.35% of assessed value annually. Prospective home buyers must factor these local tax rates into their monthly mortgage escrow calculations when purchasing real estate.
Looking for More Information on Lowell? Explore Additional Guides
Want to explore further? At The Urban Living Guide (TULG), we have covered different topics related to daily living and relocation needs to help you make informed decisions. Whether you are researching neighborhoods, weighing pros and cons, or planning your eventual move, check out these helpful resources:
- Living in Lowell, Massachusetts
- Pros and Cons of Living in Lowell, Massachusetts
- Best Neighborhoods in Lowell, Massachusetts
Ready to make your decision? Explore our complete guide here: Moving to Lowell, Massachusetts.
Follow The Urban Living Guide (TULG) for comprehensive USA city details, neighborhood spotlights, and financial insights across all major metropolitan areas.